Dashboards & Analytics
Buried in your own data? We design dashboards that surface what needs attention first, so teams act on it instead of scrolling past it.
Turn raw data into decisions people actually trust
-
Surface what matters
Dashboards fail when they show everything and prioritise nothing. We design for the handful of things that actually need attention: what's changed, what's off-track, what needs a decision, ahead of the full data dump.
-
Make it legible at scale
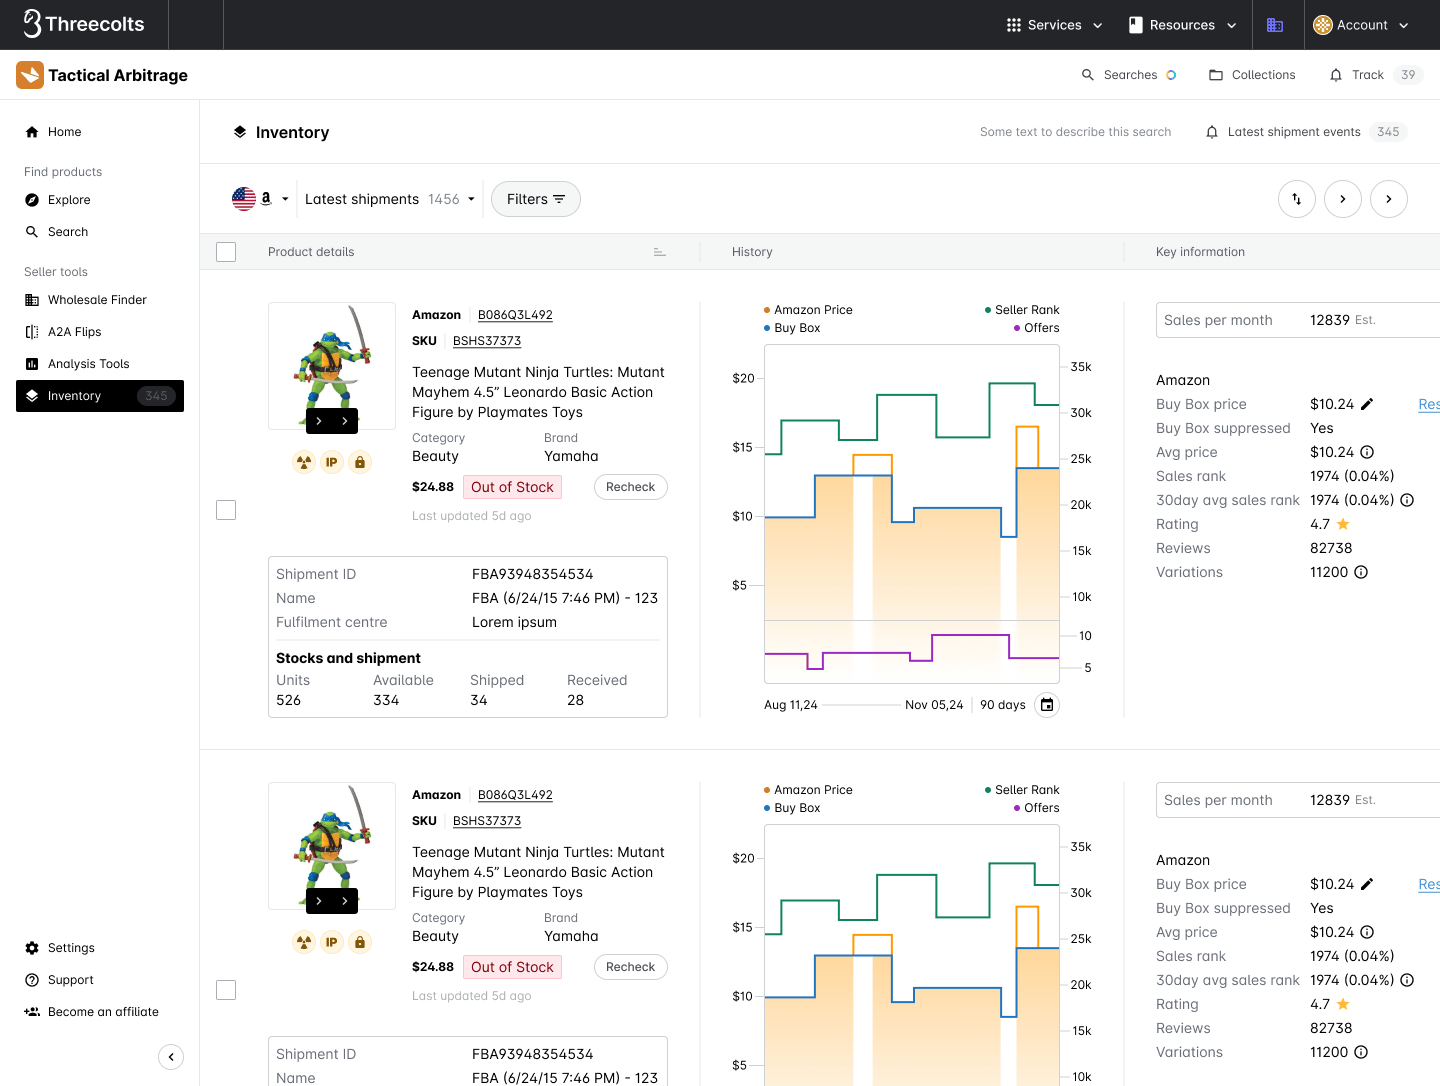
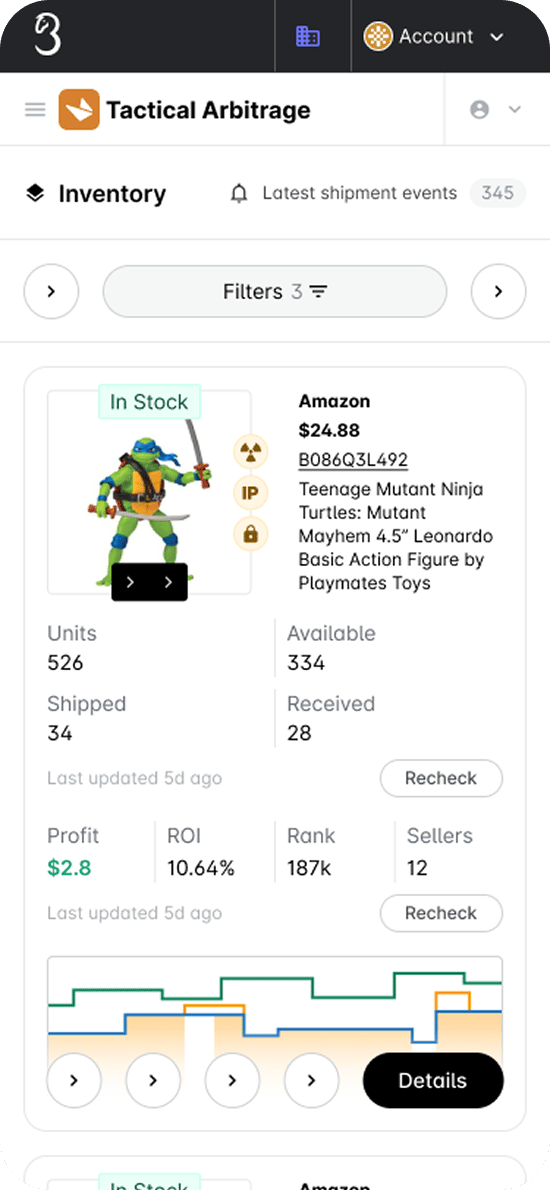
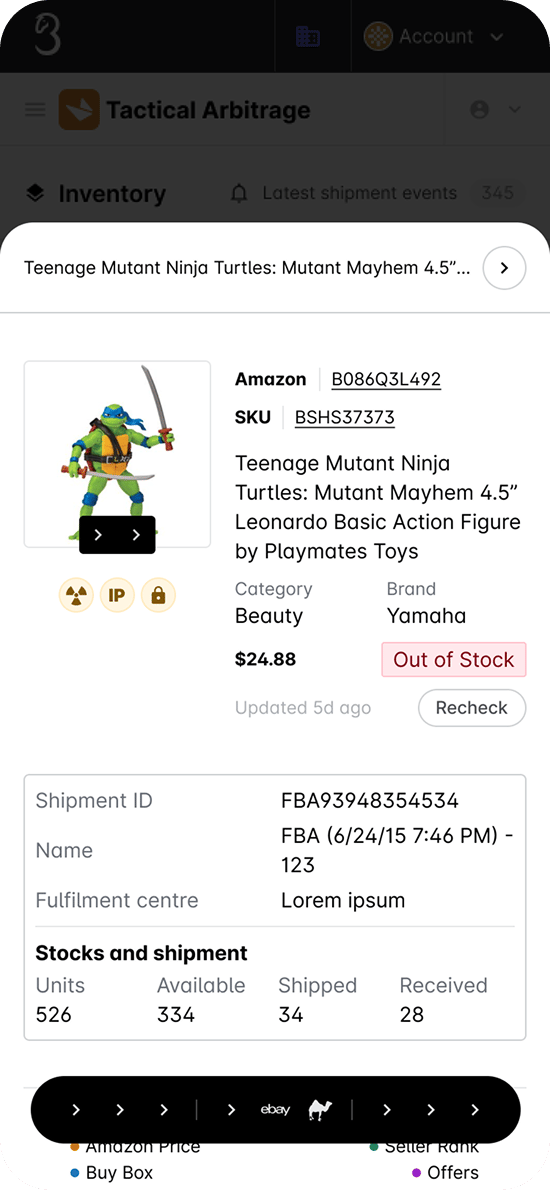
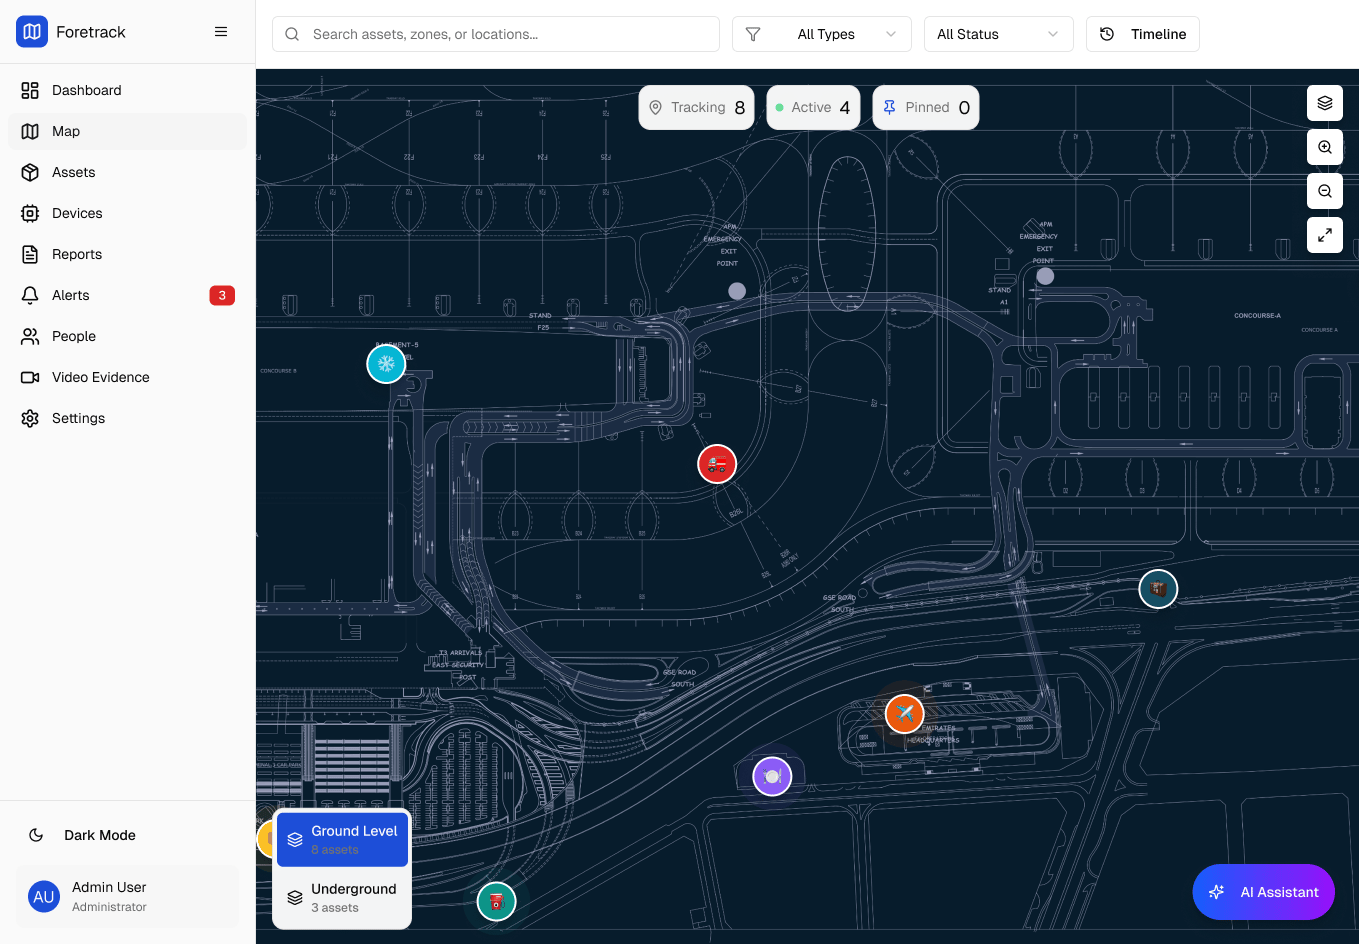
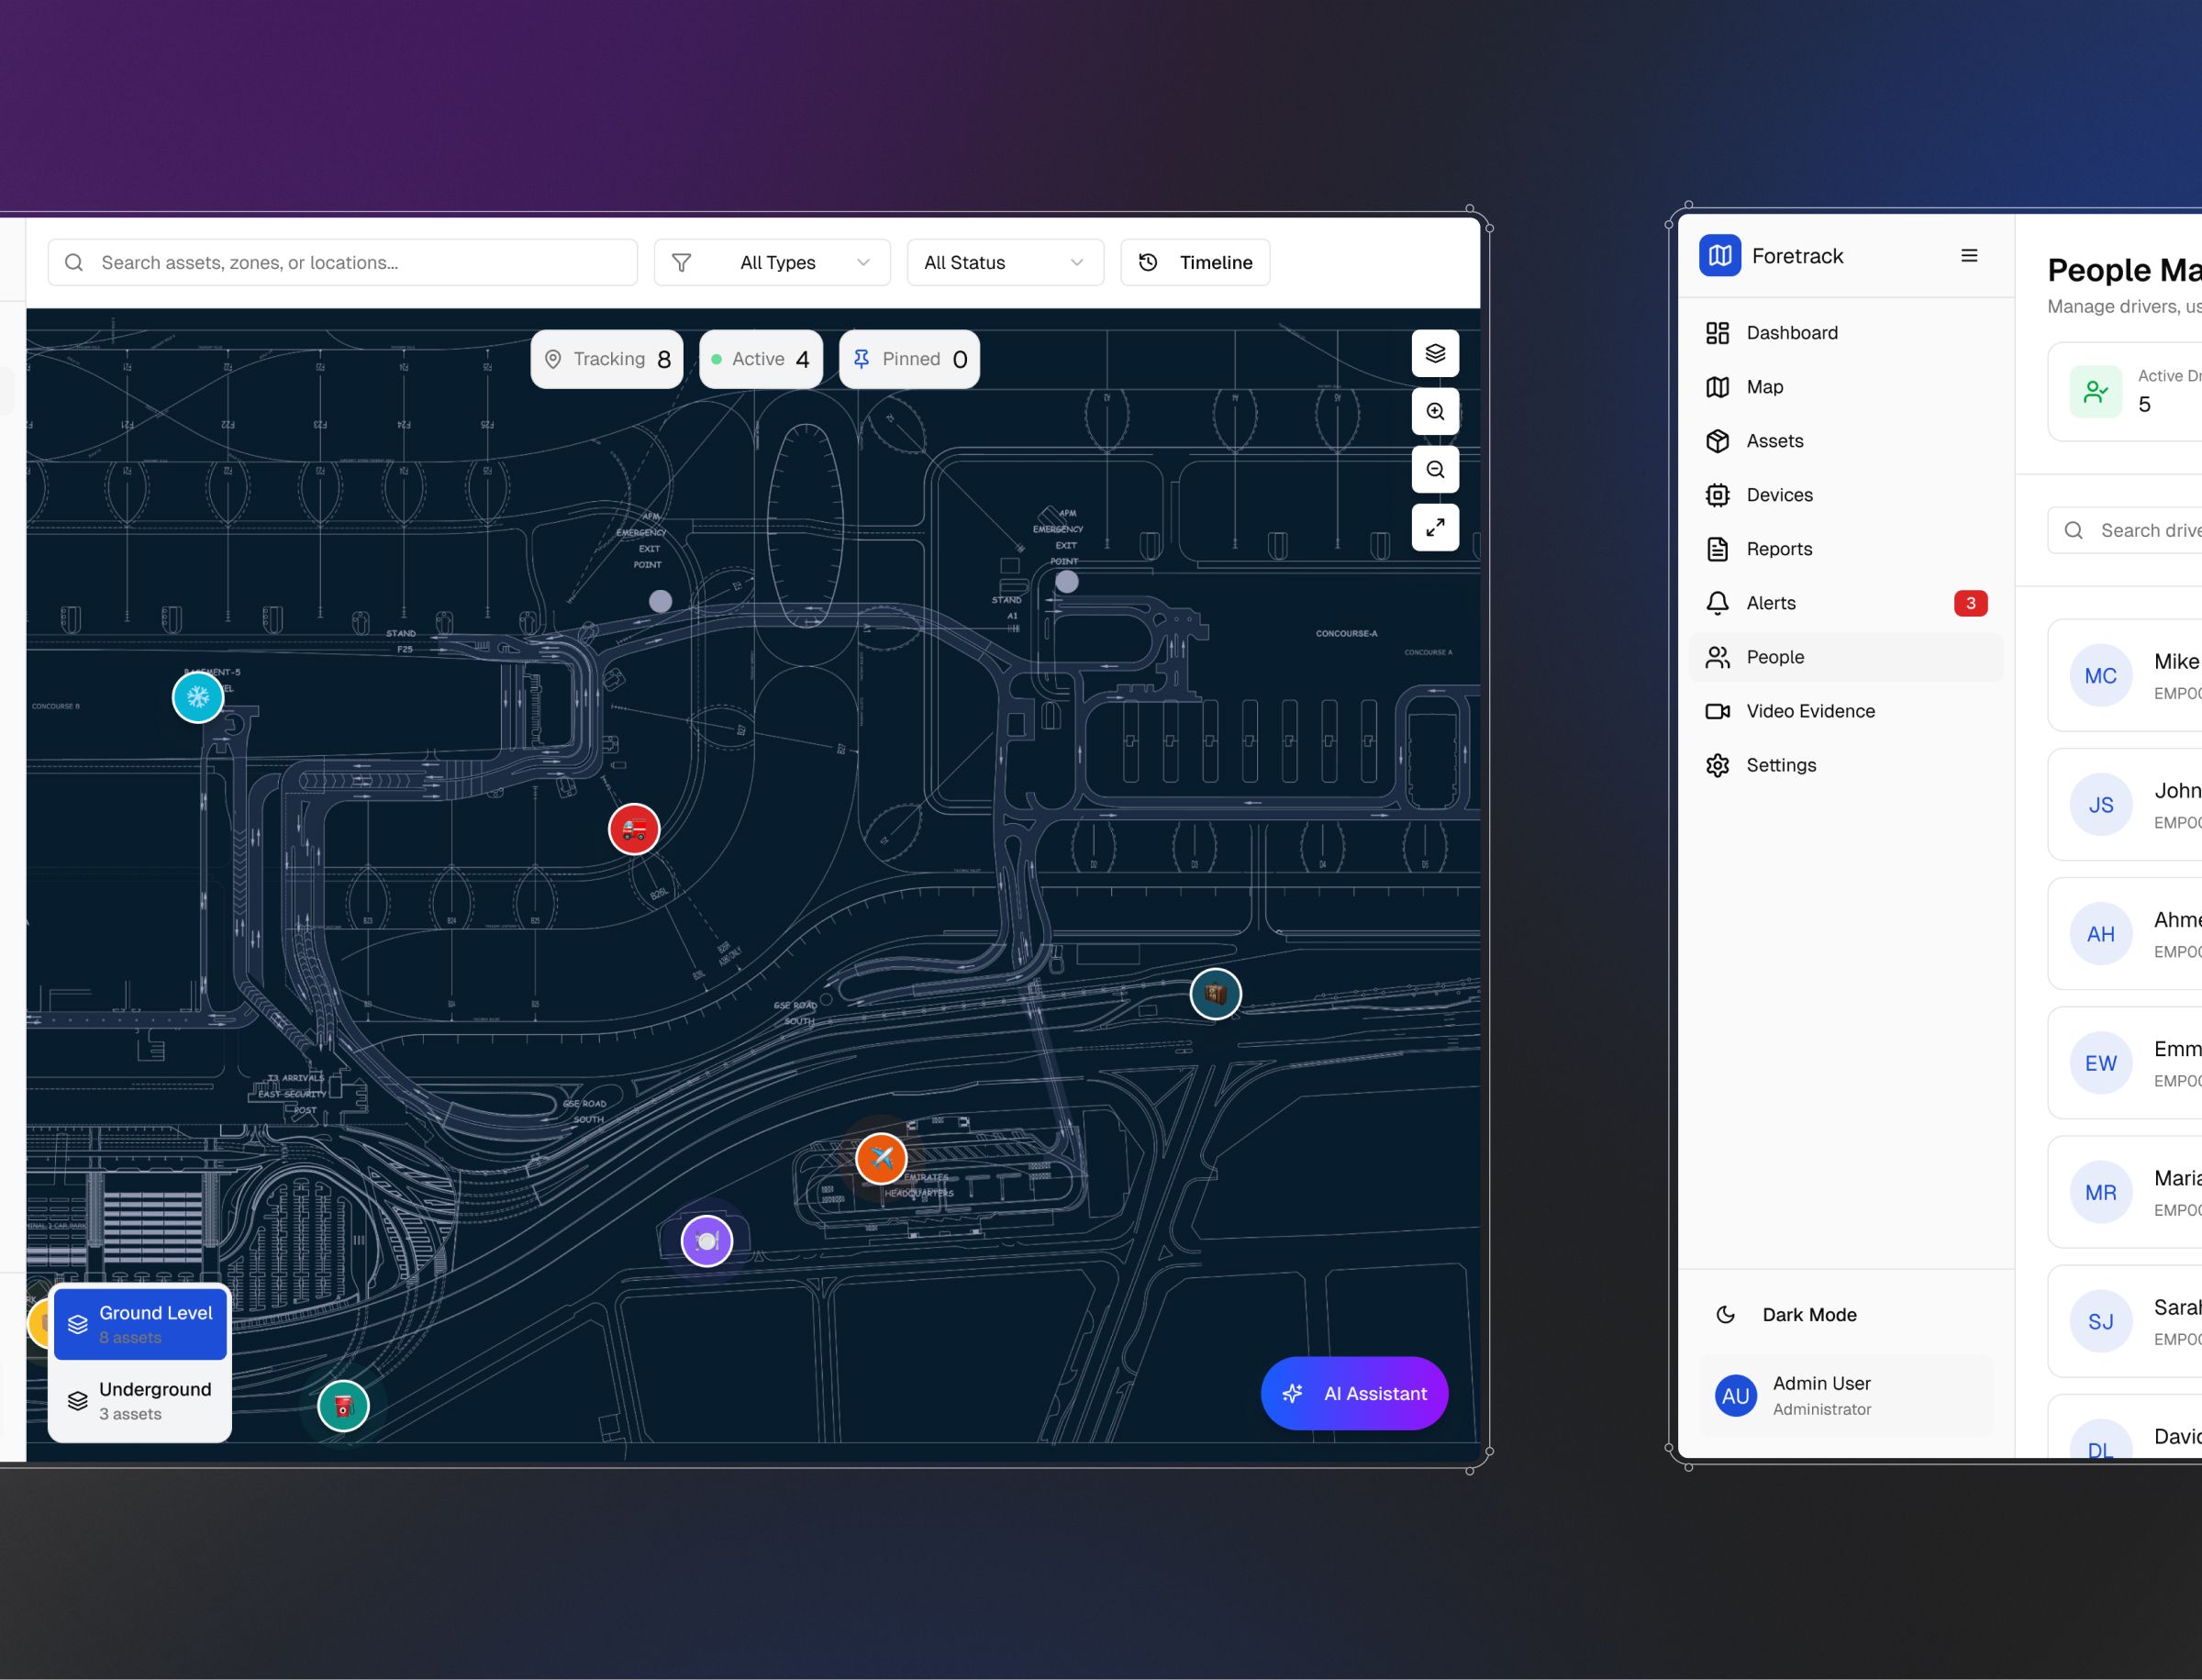
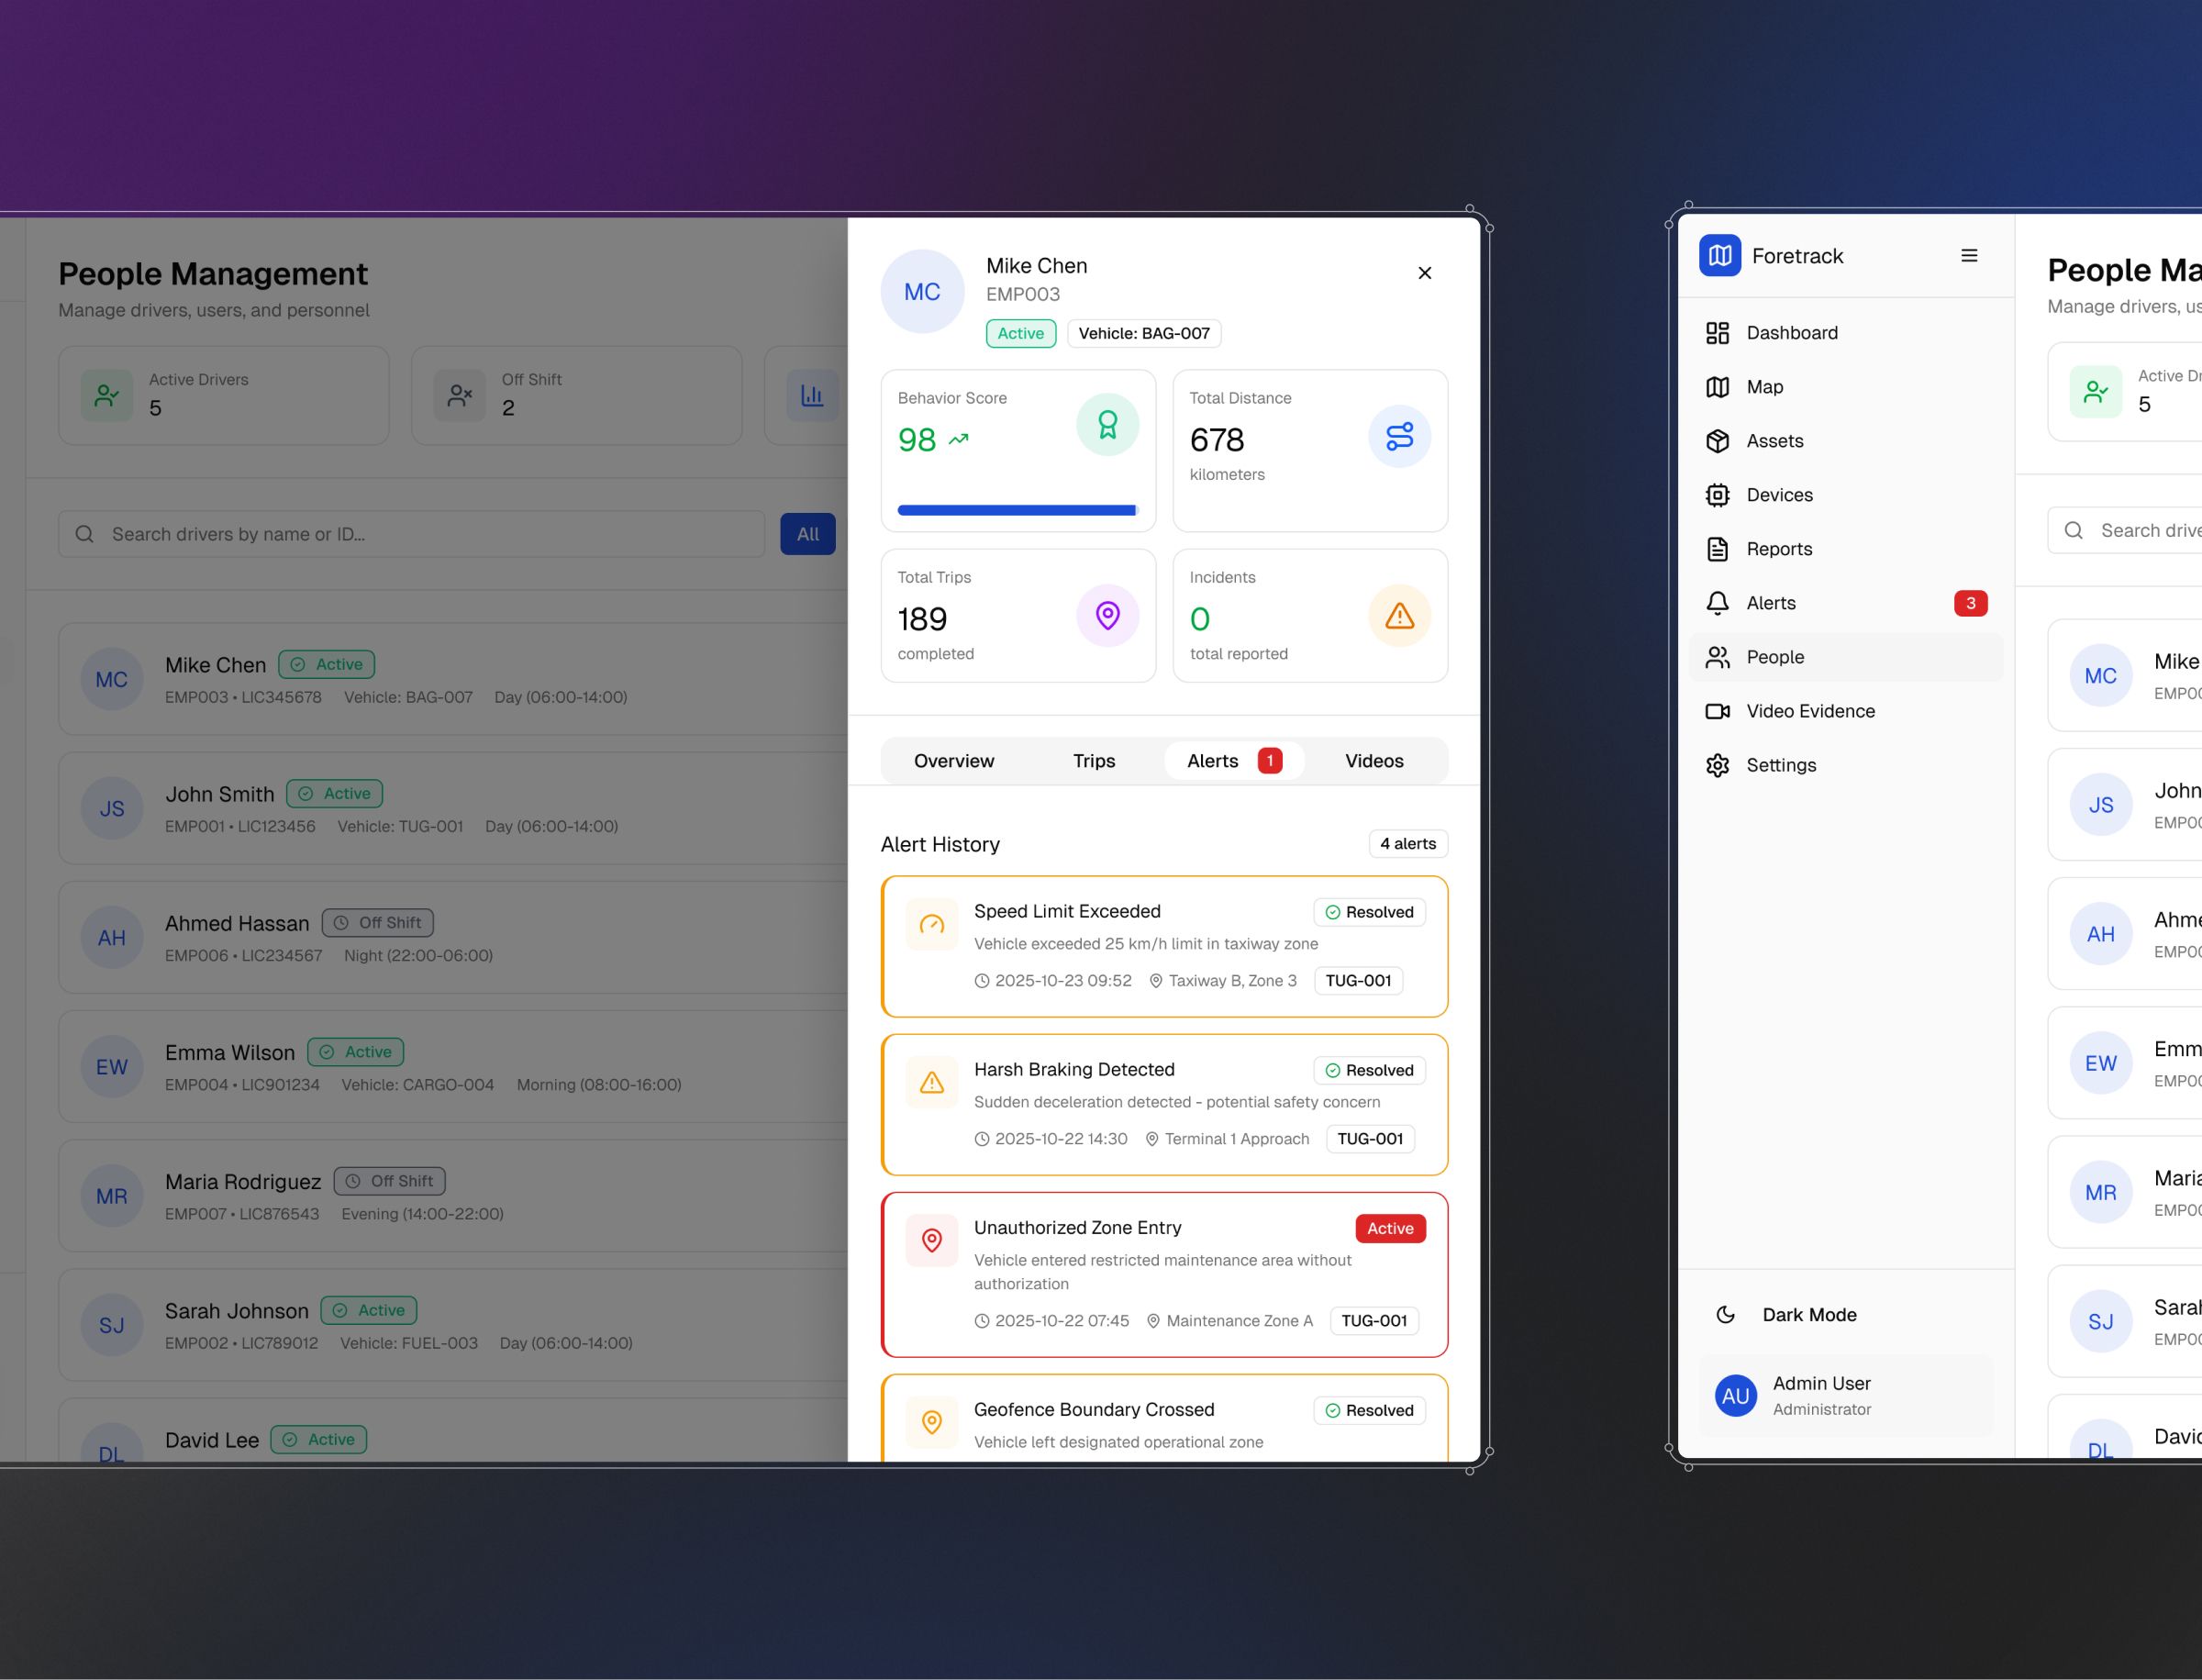
Foretrack Connect tracks thousands of assets in real time; Threecolts runs analytics across a dozen acquired tools with no shared visual language to start with. Both needed the same thing: one coherent way of reading data that holds up as the numbers grow.
-
Design for the whole team
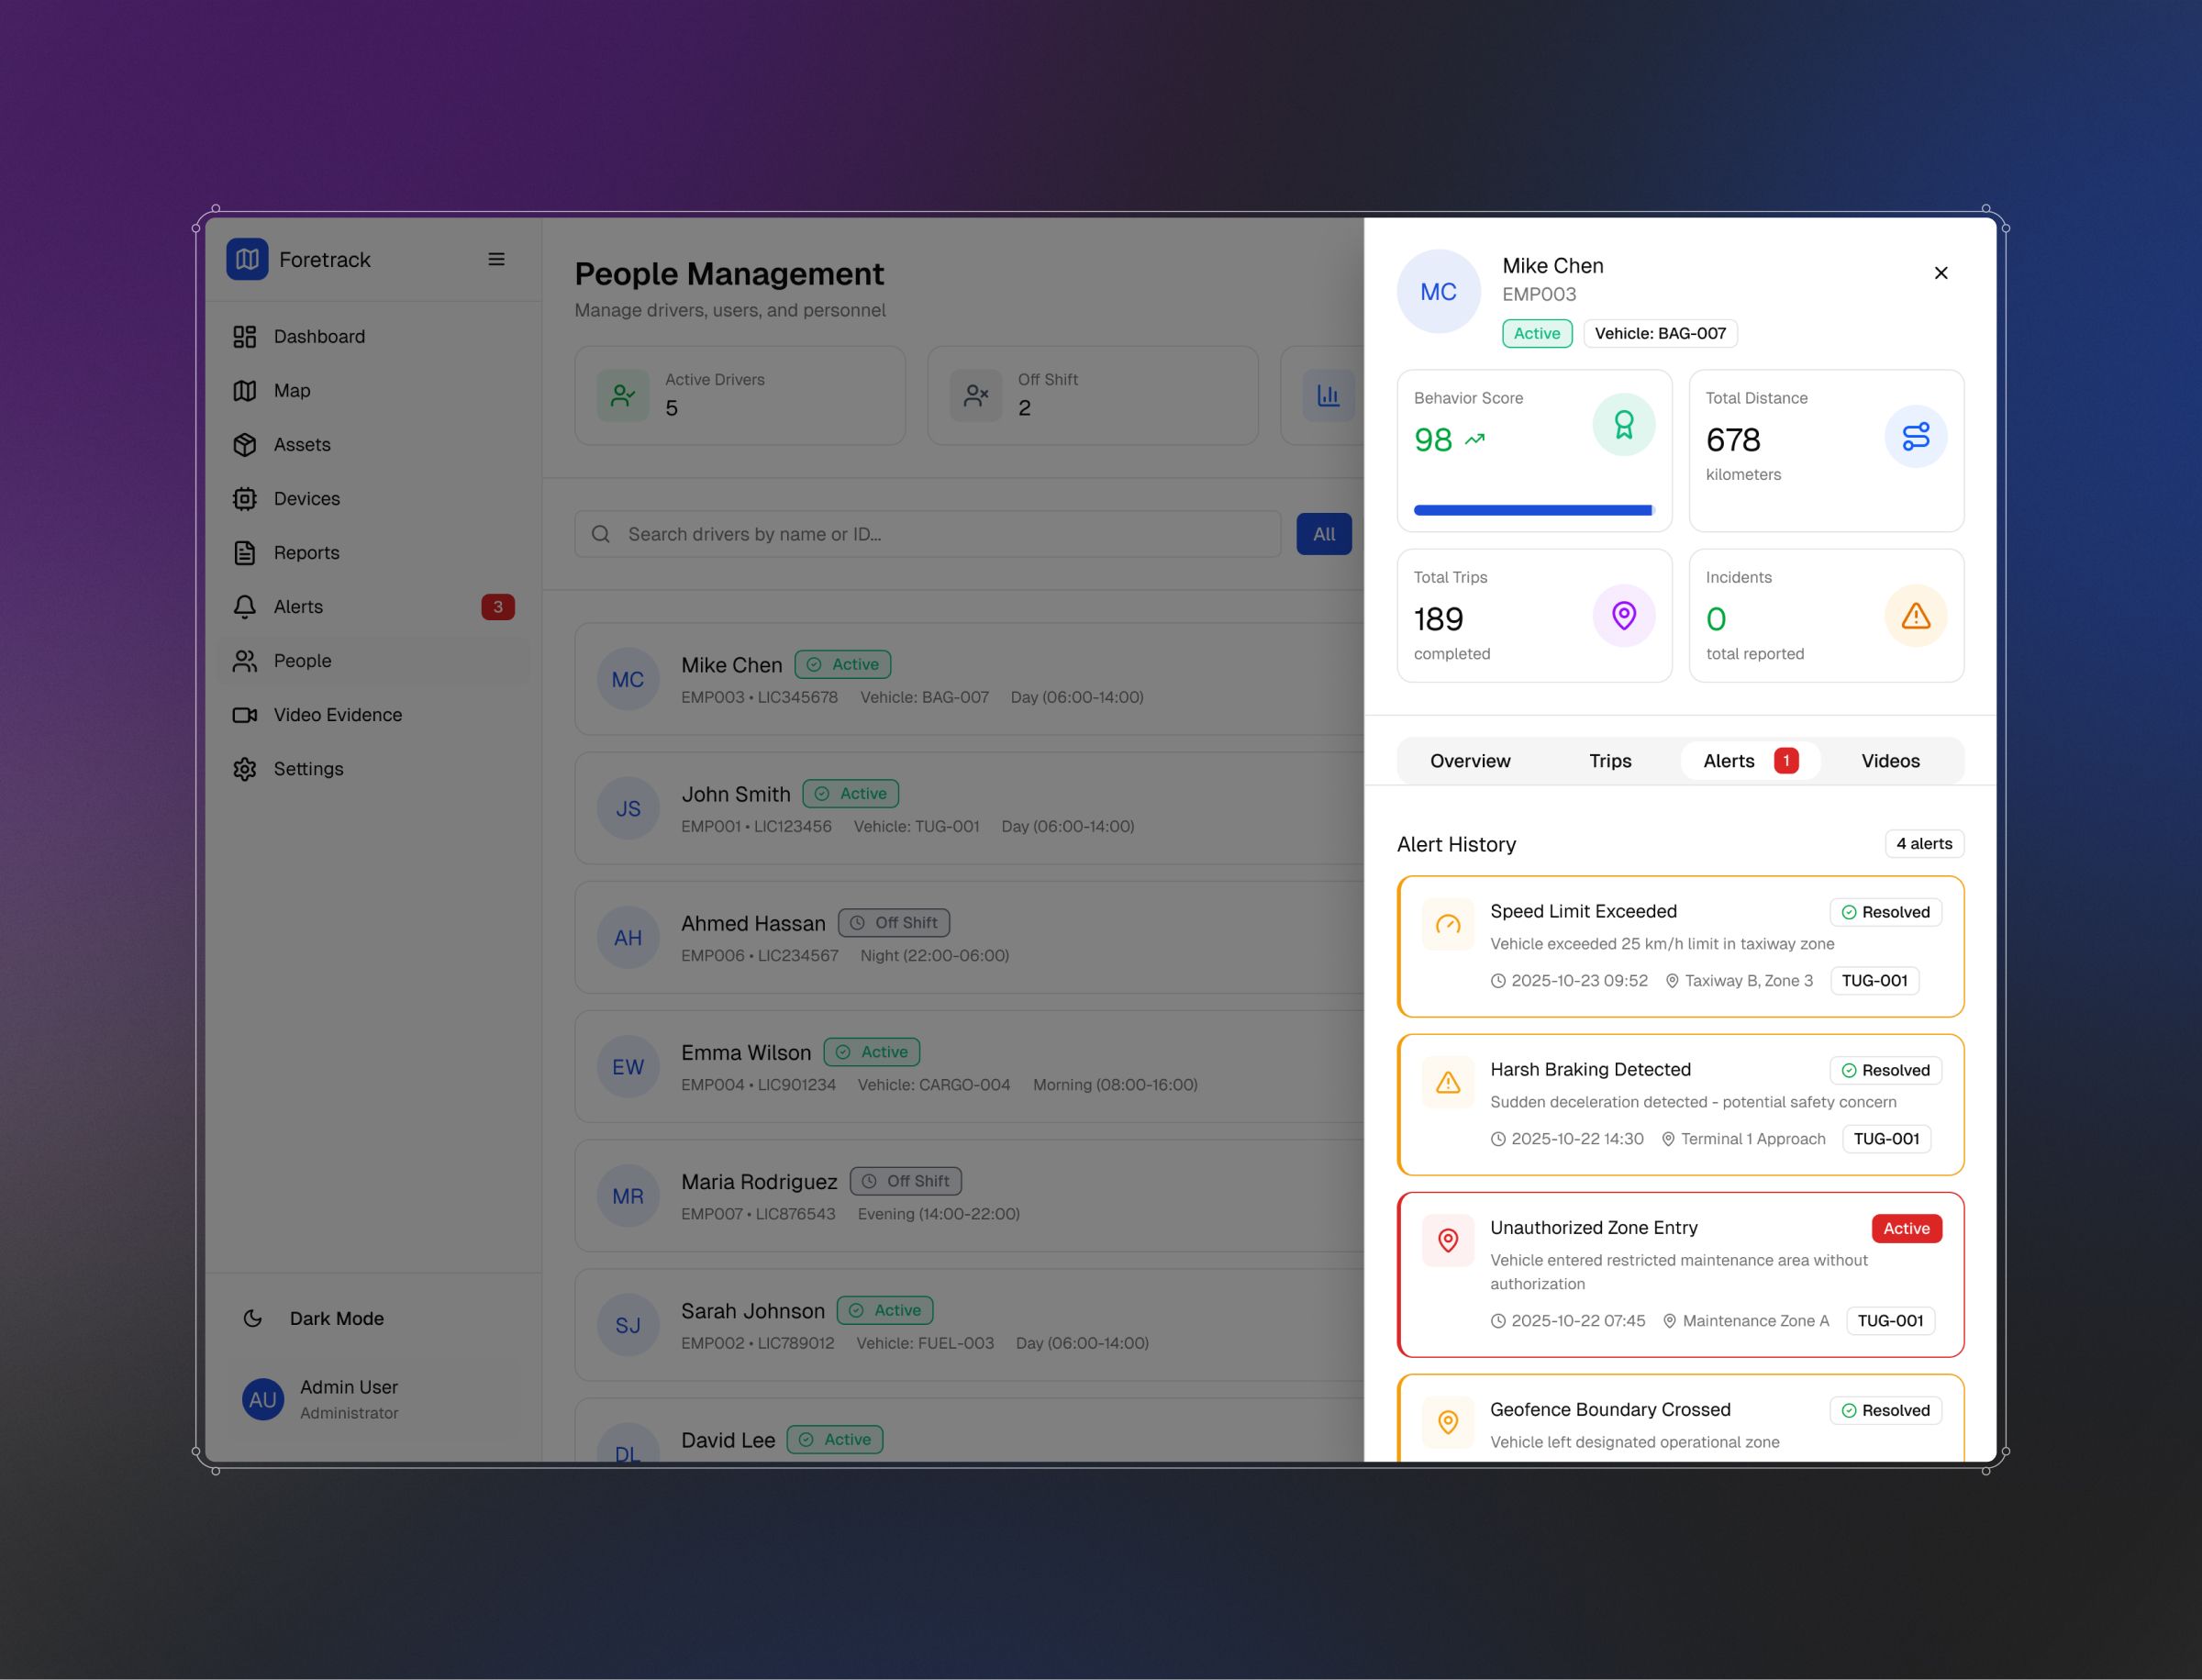
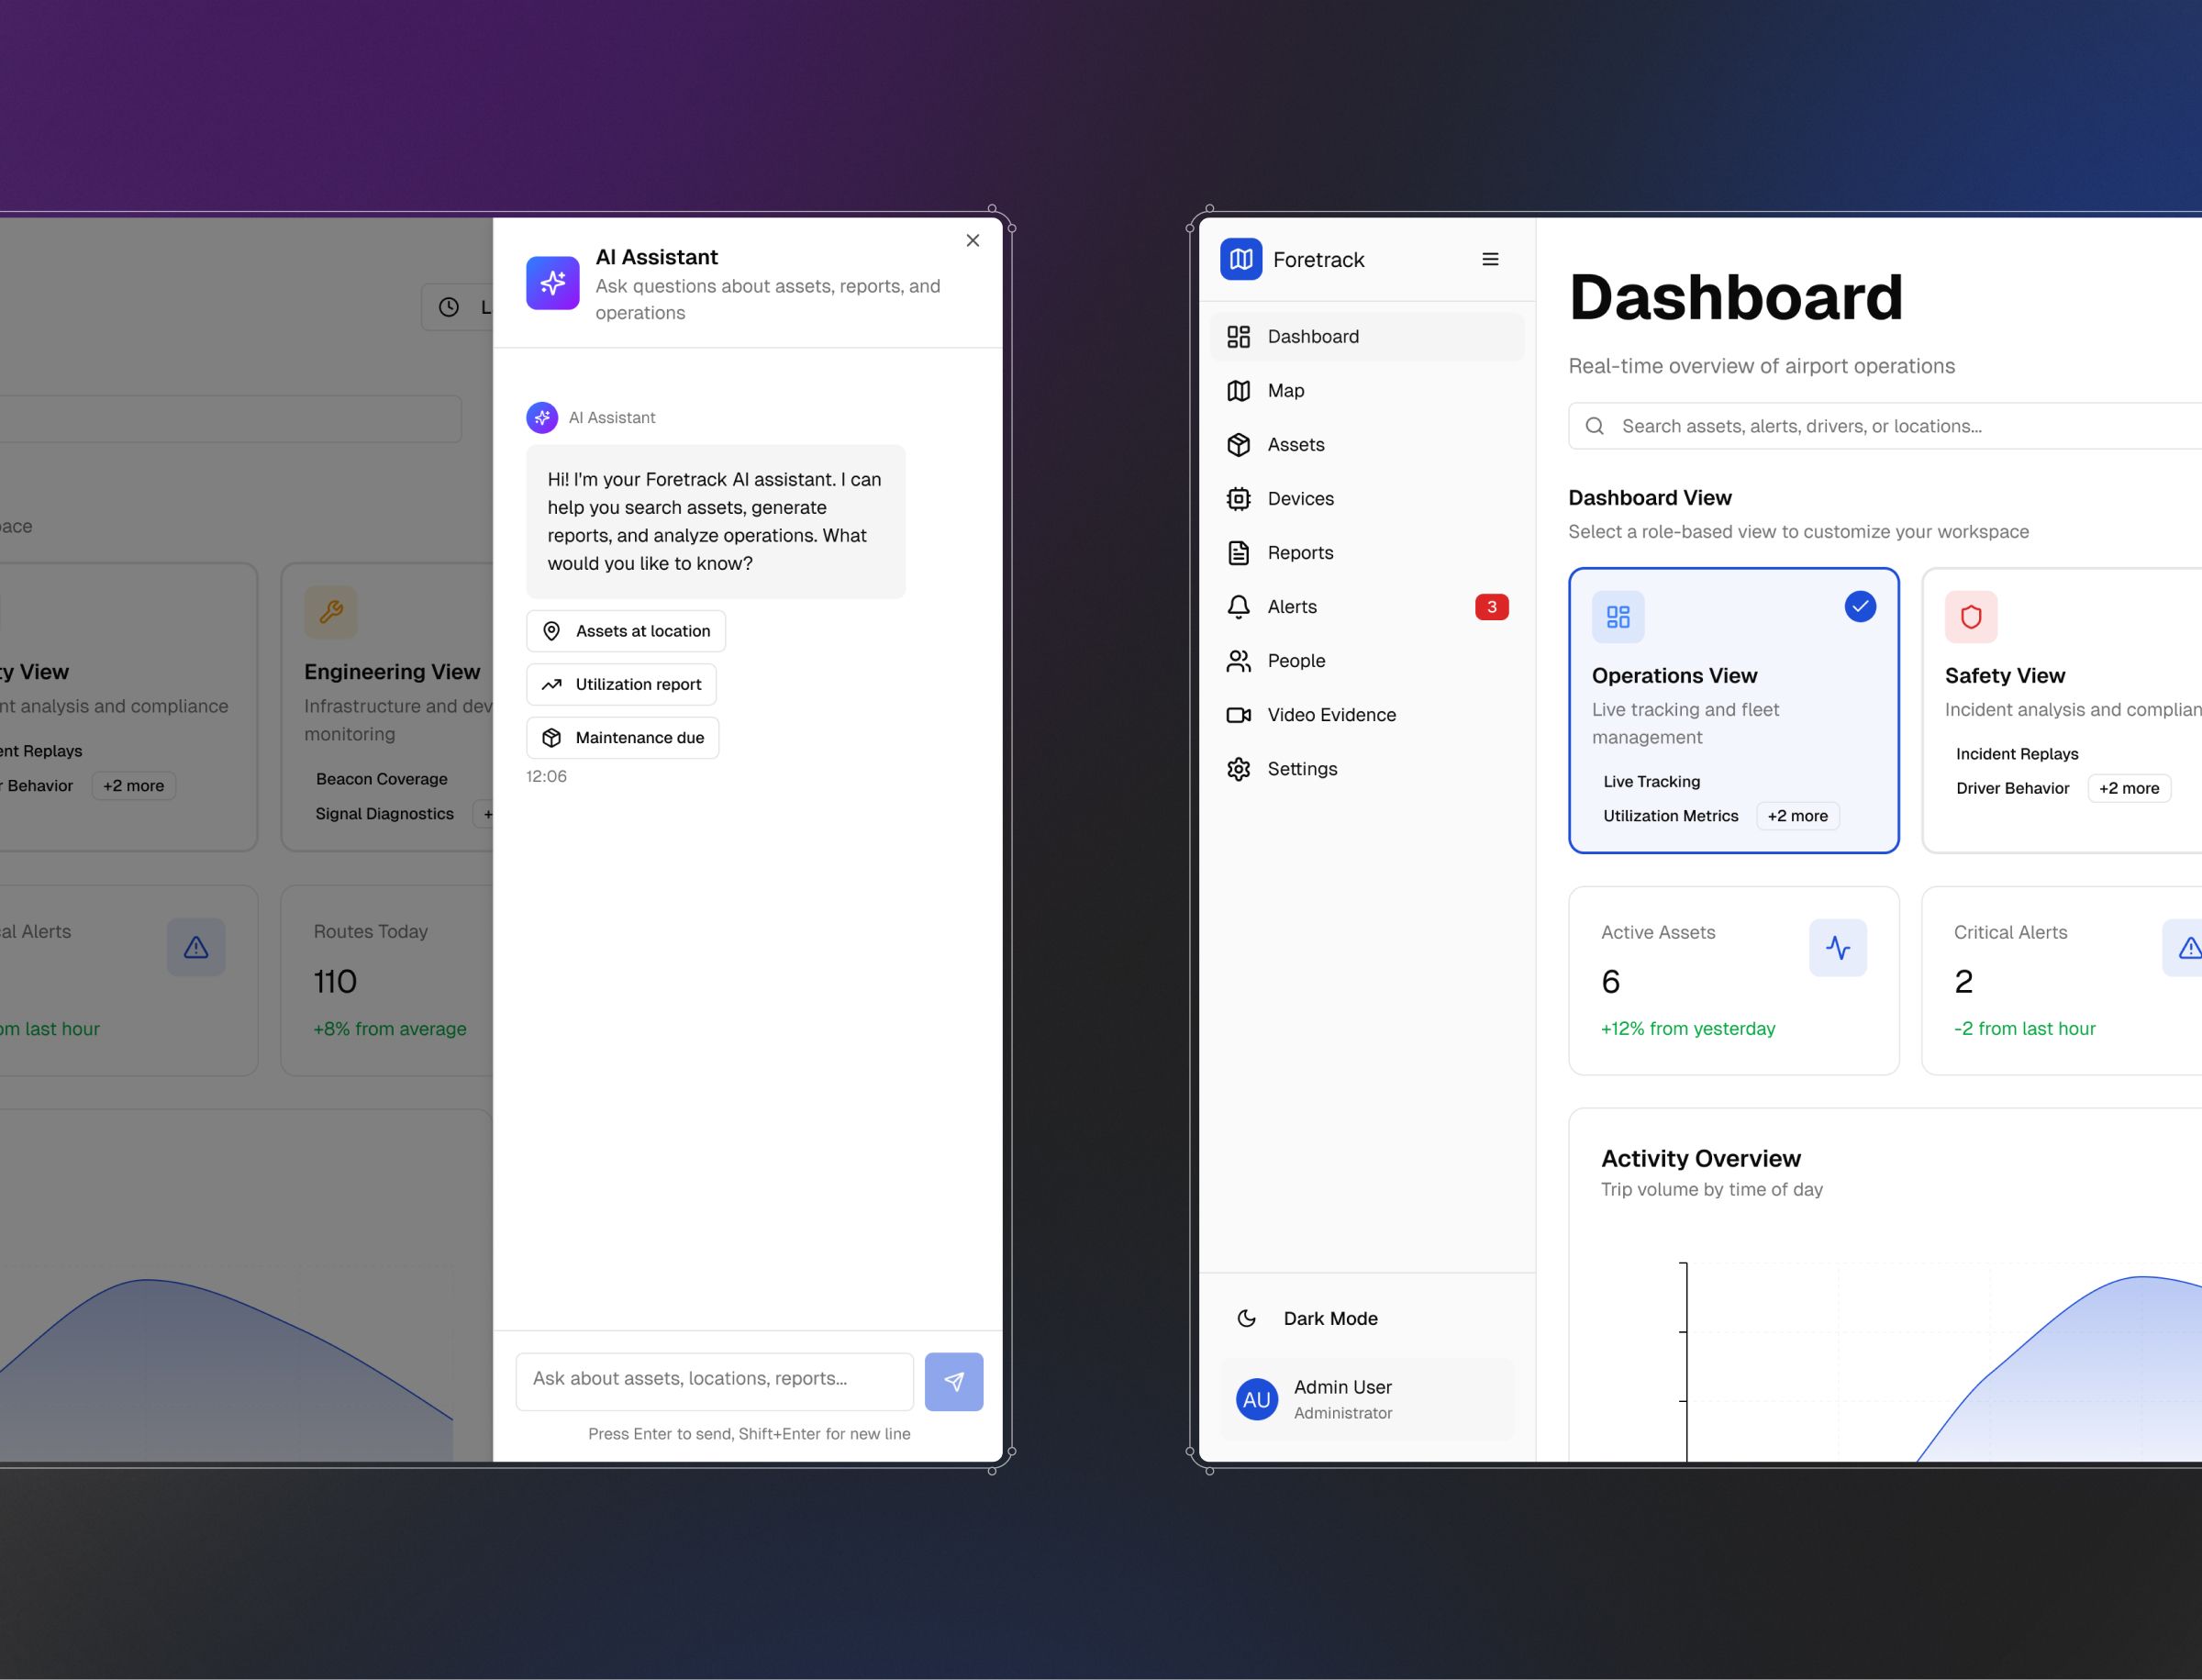
The person deciding what to do with the data is rarely the person who built the underlying system. We design views for the people actually using them, not just the people who own the data.


Making thousands of tracked assets legible at a glance
Foretrack Connect is Foresolutions' asset and vehicle tracking platform, GPS and Bluetooth trackers across motorised and non-motorised assets, feeding a live operations view. We've worked on the product design for Foretrack Connect since 2024, including its "Foretrack — Shadcn" design system and the dashboard and reporting views operations teams use day to day.
Data into decisions

One shared visual language across a dozen acquired tools
Threecolts' suite of commerce tools, margin recovery, inventory, pricing, reselling, arrived through acquisition with no shared design language. As their embedded design team, we brought the analytics and reporting screens across the suite into one consistent system, alongside the wider product, web and brand work.